


Photo by petr sidorov on Unsplash
Navigating Cartography: 5 Essential Map Elements of a map
Unveiling the Core Components for Comprehensive Map Design and Understanding


Fun fact: Maps can sometimes have 'trap streets'—fake or non-existent streets added by cartographers as a form of copyright protection. If another map includes the same fake street, it suggests they copied the original map!
Introduction
A map, as per Wikipedia, serves as a symbolic representation that highlights spatial relationships among various elements within a defined area, encompassing objects, regions, or themes. Essentially, it translates the three-dimensional Earth onto a two-dimensional surface. The graphics portrayed on a map typically consist of factual data and features, offering insights into specific locations and aiding users in comprehending the world around us, both near and far.
Maps constitute an integral aspect of our daily lives, facilitating navigation, comprehension, and explanation of our surroundings. To craft a map that communicates effectively, the incorporation of the following elements within the map development process is crucial:
Map Title

The title, also known as the map heading, explicitly indicates the map's subject. Typically positioned at the top of the map page, it is presented in large fonts for easy identification. The title includes descriptive text such as the location name and the map's purpose. For instance, consider 'CONTOUR MAP SHOWING KIBOGA DISTRICT STATIC WATER LEVEL.' Ideally, the title offers a sneak peek into the map's content and purpose.
Map Legend
A map legend, also known as the key, serves as the definitive guide listing all symbols featured on a given map along with their corresponding names. When creating a legend, symbolic graphics are used to represent features on the map, such as using a point to indicate an electric pole or a blue wavy line for a water stream.
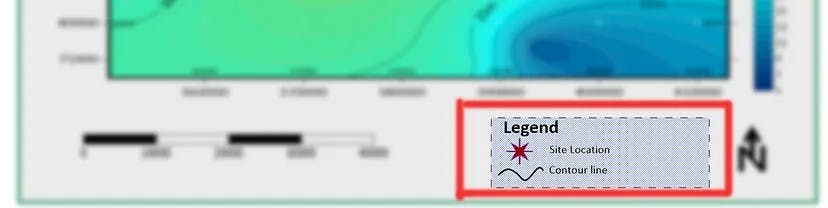
A map without a legend becomes challenging to interpret due to the ambiguity surrounding the meaning of each symbol. The choice of symbols to represent features on a map should visually tell a clear relationship with the respective features. For instance, a rectangle may represent a house, while a star or dot signifies an electric pole. As a rule of thumb, symbols in a legend should be easily categorized into three groups: polygons (which can take various shapes), polylines or lines, and points.
Compass Direction / North Arrow
The north arrow, also known as the compass rose, is a graphic symbol that displays a map's orientation relative to the north and south. Its ideal design allows it to move or rotate with the map for consistent direction reference.
Generally, a north arrow sits vertically on a map. However, when a map is tilted or rotated, the arrow should adjust accordingly to maintain its directional clarity.

One may wonder when do we need to use the North Arrow. The use of a north arrow may seem arbitrary, but it serves an important purpose - to orient maps to the direction of the true north. In the Northern Hemisphere, most maps are oriented in a north-south direction in the vertical order by convention. However, this is not always the case. When maps are oriented differently, a north arrow becomes necessary to indicate the proper alignment with true north. It provides critical context that prevents confusion when the top of the map does not correspond to due north. The north arrow solves the problem when mapping conventions are not followed.
Map Scale
In cartography, scale refers to the relationship between a distance or extent on a map and the equivalent distance or area on the ground, typically expressed as a fraction or ratio. For instance, a scale of 1:10,000 means that 1 centimeter on the map represents 1 kilometer in real space on the ground.

The concept of scale on a map has always been somewhat perplexing, not only to me but also, I'm sure, to many others. This confusion might stem from how the scale is read compared to how it is implemented. In simple terms, the smaller the map scale, the larger the map extent. Map scale is usually indicated on a map in the form of a ratio (e.g., 1:10,000) or through a bar scale, as illustrated in the image above, and sometimes both.
Beyond aiding the map reader in translating the represented distance on a map to the actual distance on the ground, the map scale also plays a crucial role in determining the amount of content or features a map will include. This is achieved through the functions of 'zoom in' and 'zoom out' on a map. In other words, the map scale influences the extent of the map content visible, either on screen or in print.
Map Neatline
Sometimes, distinguishing between a Neatline and a Frameline and understanding how they relate to a data frame on a map can be a bit confusing. To add to the complexity, some cartographers use these terms interchangeably. Let's untangle the confusion!
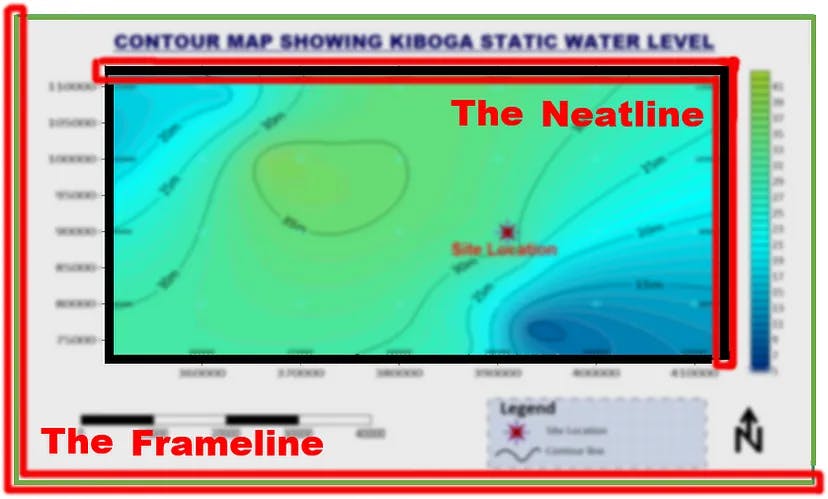
In brief, a Neatline is the outlining border that delineates and defines the edges of the mapped extent marking what’s within its boundaries and what falls outside. This essential border excludes elements like the legend, scale, and title keeping the focus on the map’s core content.
The Frameline, on the other hand, acts like a picture frame. It encloses everything on the map, including the Neatline itself. Interestingly, within this frame, a Neatline may not always exist. For instance, maps of entire countries or continents often omit a separate Neatline because the Frameline already defines the mapped area.
So, why is the Neatline crucial? In maps brimming with information, it cuts through the clutter, pinpointing the precise end of the mapped area. This becomes especially vital when zooming in on smaller-scale maps. Without the Neatline, the map's boundary could become blurry, leaving viewers unsure of what they're seeing.
Other Elements found on a map
Beyond the five essential elements that make a map effective, professional versions often include additional details for clarity and good practice. Two such elements are:
Inset maps (or locator maps): The inset map shows the location of the main map within a broader geographical area. This helps viewers understand where the main map is situated and how it relates to surrounding regions. Imagine you're looking at a detailed map of a city park. An inset map might show the city layout with the park highlighted, giving you a sense of the park's location within the city.
Map credits: This vital information reveals details like the cartographer's name, data sources, and publication dates, enhancing transparency and user trust.